Overview
Oracle EPM Cloud comprises the full suite of Oracle Enterprise Performance Management Cloud business processes supporting a comprehensive array of activities spanning planning and budgeting, consolidation and close, account reconciliation, profitability and cost management. Dashboards in Oracle Planning and Budgeting Cloud Service (PBCS), a key part of Oracle EPM Cloud suite, are an extremely powerful and intuitive tool to use during the planning and forecast process. The versatility of dashboards enables users to chart, evaluate, highlight, comment on, and even change key business data. They can change a driver in a form that’s in a dashboard and immediately see its impact in other forms and charts.
Creating and Managing Dashboards 1.0:
Creating Dashboards 1.0:
Below is the navigation for creating a Dashboard.
From the Home page, click Dashboards, and then click Create –> Dashboard

Enter a name by clicking the default dashboard name and entering a new name in the input box. You can give the dashboard a title with custom formatting. For that, click Settings, clear “Use name as title” and then enter the title and set formatting for the dialog box.

From the design palette on the left, drag and drop objects onto the dashboard canvas.
You can select the below objects to show in dashboard.
Forms, Chart Types, Tile, Commentary, URL.
Below are the Chart Types that you can find in the list and you can drag the required one.

For Example, below is a Line Chart view in the screen.

You can show the forms in different chart view by dragging the chart type into the dashboard and assigning the form to the chart from the Data Option as below.

Similarly, you can drag other charts and below is the example for Gauge Chart.

For example, here’s a form’s data:

Here’s the resulting dial gauge:

Note:
If a cell in the form is missing a value, no gauge is displayed for that cell. Also, you must specify at least 2 consecutive thresholds. The application needs the middle threshold value to calculate the chart.
You can perform the below actions in the dashboard.
- Include up to six forms that dynamically update, including their associated charts, as users change data in the form.
- Include up to nine charts or tiles. Tiles display a specific value from the cube. To provide the value for each tile, you can specify a form or a cell intersection as a data source.
- Switch easily between using the design mode and runtime mode, so you can see exactly what the dashboard user will see.
- Depict data interactively with a wide variety of chart types such as area, bar, bubble, column, combination bar and line, doughnut, funnel, gauge, scatter, radar, and so on.
- Control the dashboard’s layout.
- Depending on the form design, enable users to drill down into underlying detail and select which members to work with.
- Include user variables in the global POV bar and the local POV.
- In certain charts, customize the colors and line width, and show or hide gridlines.
In 1.0 dashboards:
- Add links to dynamically display external Web pages.
- Include explanations of data called Commentary in the dashboard.
- Tag a form as master and then filter members from the master form to detail forms or charts within the same dashboard.
Global and Local POV in Dashboard 1.0:
A local POV on a form reflects the dimension members the form designer selected for that form. Dashboards also support global POV bars, so that the local POVs that are common are combined in the global POV bar to avoid repeating them in each object.
Dashboard 1.0 POVs Example
Here’s a 1.0 dashboard showing a global POV bar (showing Entity, Product, and Year) and a local POV (the Plan drop-down list showing Q2):
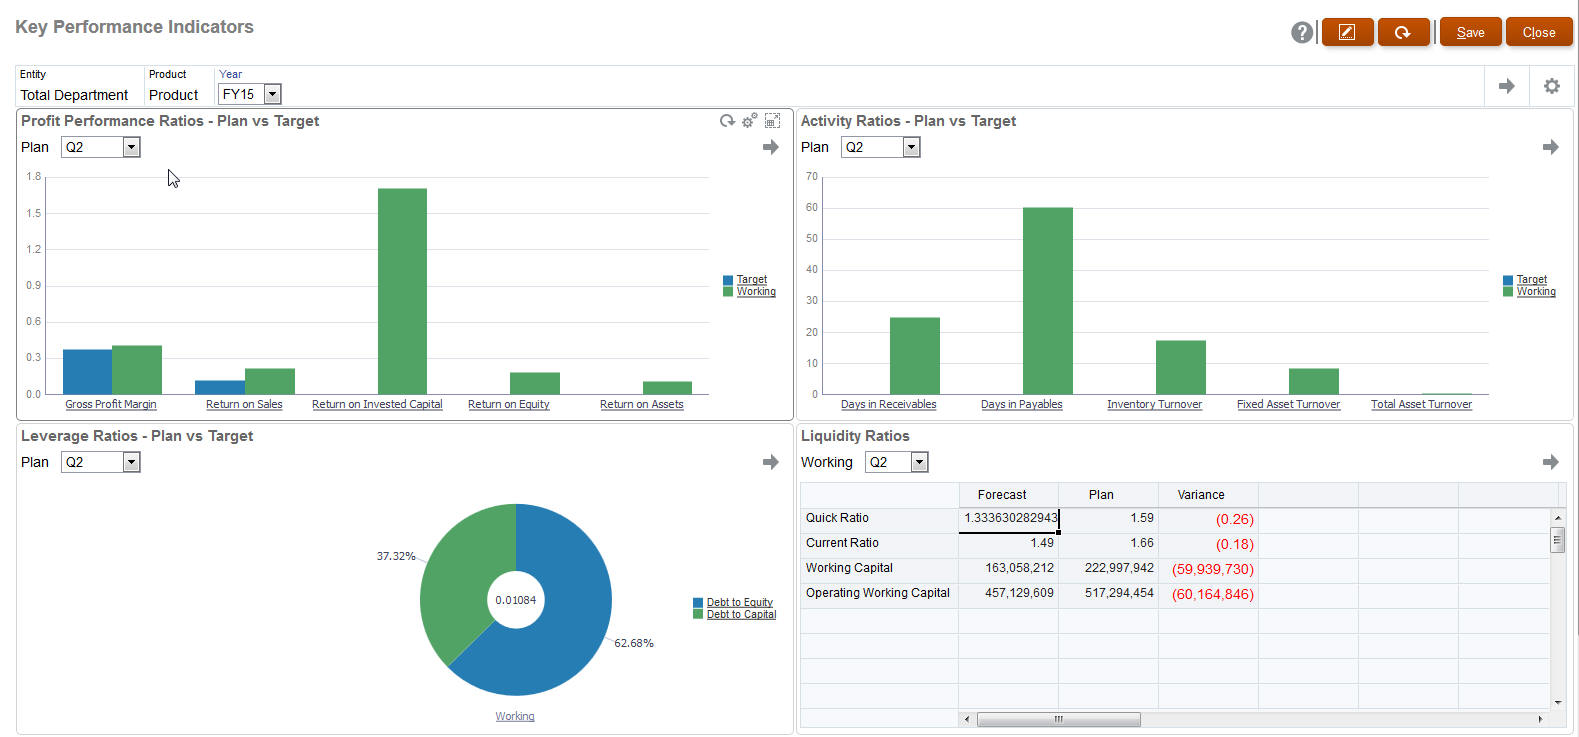
With a global POV bar, if you change a page in the global POV bar and then click GO, the page changes for all objects that are based on forms. The global POV bar displays at the top of the dashboard above all the objects, while the local POV bar displays within the object. User variables are supported in both global and local POVs in dashboards.
About global POV bars:
The POV Bar is made up of local POV dimensions, Page dimensions and user variables.
Depending on the local POV and page of each form on the dashboard, the global POV bar is automatically calculated.
They are reflected in the other objects using forms in that dashboard. That is, they apply to forms in a dashboard, to charts that are linked to forms, and to tiles that use forms as a data source. So if the dashboard doesn’t include a form as a data source, then neither the local nor global POV bar is available.
Here’s an example of how the global POV bar is calculated, based on the local POV dimensions for two forms:
The global POV bar is disabled:
Form A local POV: Year, Entity, Product
Form B local POV: Year, Entity, Project
The global POV bar is enabled:
Global POV bar: Year, Entity
Form A local POV: Product
Form B local POV: Project
That’s an overview on Dashboards 1.0 in Oracle PBCS. Have you used dashboards in PBCS? If so, let us know your experience in the comments below. In my next article, I will talk about Dashboards 2.0 and it’s difference in comparison to 1.0.