Overview
Oracle Analytics Cloud retains a lot of functionality that OBIEE offers. One such feature is Usage Tracking, which, most companies who have implemented in OBIEE will want to implement in OAC as well. Usage Tracking is even more relevant in a cloud implementation because one needs to know the usage so that they can make decisions to upscale/downscale(which impacts the costs incurred).
In this article, let’s go through the steps required to setup Usage Tracking in Oracle Analytics Cloud(OAC). Below are some key points about Usage Tracking
- Usage Tracking is used to monitor system and ad-hoc query performance and to provide input on usage trends for use in billing users and departments for resources.
- Usage tracking is particularly useful in determining user queries that are creating performance bottlenecks, based on query frequency and response time.
- When usage tracking is enabled, the Oracle BI Server collects usage tracking data for each query and writes statistics to a usage tracking log file or inserts them directly to a database table
- Administrators set up the criteria to track user queries and generate usage reports that can be used in a variety of ways such as database optimization, aggregation strategies, or billing users or departments based on the resources that they consume
Prerequisites:
- Oracle Analytics Developer Client Tool to manage your data model (RPD file)
- Usage Tracking requires an access permission to a database where you want to store usage information. User login with Create table privileges on the database schema.
Steps to configure Usage Tracking in OAC:
- Create a dedicated connection pool for Usage Tracking in RPD. This connection should point to a database where Usage Tracking tables will be created and maintained
- Open RPD which is deployed in OAC, create a new database in Physical layer and provide a name(Usage_Tracking in this example) and choose the database type
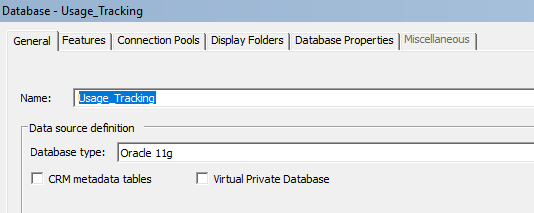
** Make sure the names given for database and connection pool doesn’t have spaces.
- Create new connection pool under this database and provide name (UsageTrackingConnection). Provide the database details where Usage Tracking tables need to be created and provide login credentials to the schema
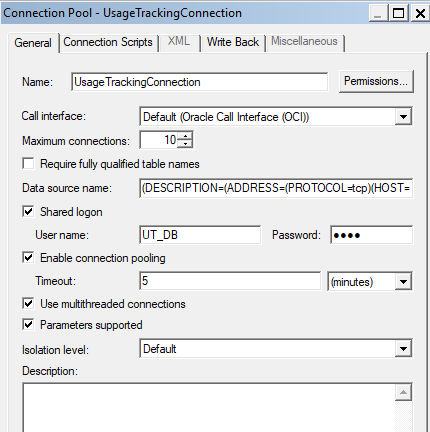
- Create a physical schema in RPD. The name of the schema in RPD should be the same as database schema name(UT_DB)

- Save the RPD and upload it in OAC.
- Log in to OAC DV URL
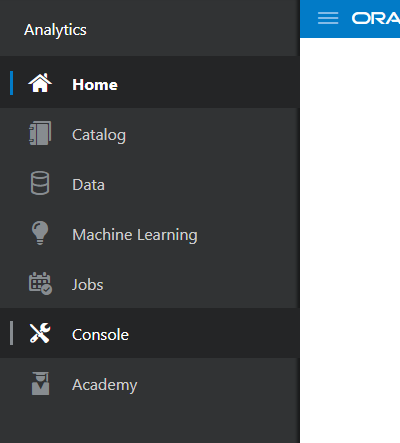
- Click on Console from the Hamburger menu at the left top
- Click on System Settings
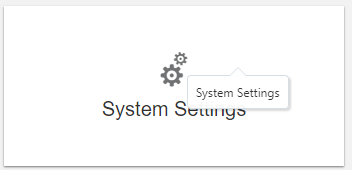
Now, let’s understand the Usage Tracking settings and respective formats. Make sure the formats you enter in these respective fields match exactly with the RPD setup that was done above.
- Usage Tracking Init Block Table:
Format: <Database>.<Catalog>.<Schema>.<Table> or <Database>.<Schema>.<Table>
Example: Usage_Tracking.UT_DB.INIT_BLOCK_INFO
- Usage Tracking Connection Pool:
Format: <Database>.<ConnectionPool>
Example: Usage_Tracking.UsageTrackingConnection
- Usage Tracking Physical Query Logging Table:
This the table where details about the physical queries executed by BI Server against the underlying database are tracked
Format: <Database>.<Catalog>.<Schema>.<Table> or <Database>.<Schema>.<Table>
Example: Usage_Tracking.UT_DB.PHYSICAL_QUERIES
- Usage Tracking Logical Query Logging Table:
This is the table where details about the logical SQLs executed by BI Server are tracked
Format: <Database>.<Catalog>.<Schema>.<Table> or <Database>.<Schema>.<Table>
Example: Usage_Tracking.UT_DB.LOGICAL_QUERIES
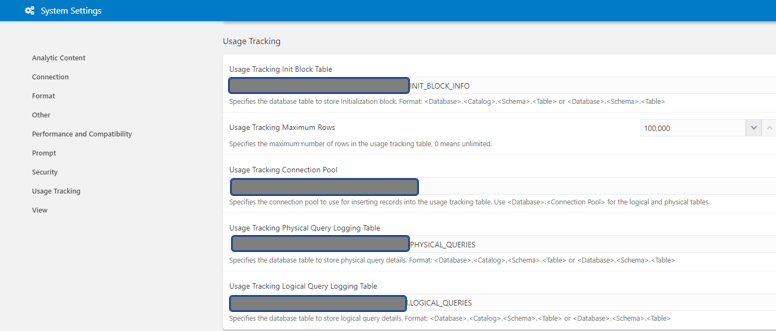
- One can also control the max number of rows that the Usage tracking tables can hold. Enter 0 if you want to set it to Unlimited.
- Once the settings are complete, restart the OBI Server by clicking in Restart button that gets enabled on the top right side of the page. This gets enables only after we change any settings in the System Settings.

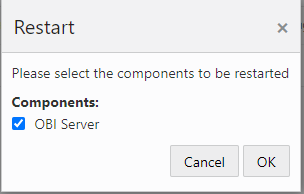
Once the restart is complete, the 3 Usage Tracking tables will be created in the database and the Usage will be logged into the tables. One can view the data by connecting to the database from the Backend or by building a Subject area using these tables in the RPD.
Below are some of the important columns from the Usage Tracking Tables
Important Columns in Logical Queries Table
| END_TS | End time of query execution |
| ERROR_TEXT | Error message if the query has errored out |
| ID | Primary key |
| QUERY_TEXT | Actual query text |
| RESP_TIME_SEC | Total response time of query in seconds |
| ROW_COUNT | Number of rows returned by the query |
| SAW_DASHBOARD | Dashboard name where query is getting generated |
| SESSION_ID | Session ID from the user firing the query |
| START_TS | Start time of the query execution |
| SUBJECT_AREA_NAME | Subject area used for the query |
| USER_NAME | User ID who has executed the query |
Important Columns in Physical Queries Table
| ID | Primary key |
| LOGICAL_QUERY_ID | Foreign key from the logical queries table |
| QUERY_TEXT | Query text |
| TIME_SEC | Time taken by query to complete |
| ROW_COUNT | Number of rows returned by the query |
| START_TS | Start time of the query |
| END_TS | End time of the query |
The join between these 2 tables can be performed using the join condition:
LogicalQueries.ID = PhysicalQueries.Logical_Query_ID
Once Usage Tracking is enabled, the system usage can be analyzed from DV too. Create a DV connection to the Usage Tracking database, create datasets for the Physical Queries and Logical Queries tables and analyze them within a DV project.
As you can see, setting up Usage Tracking in OAC is a very easy process. Usage Tracking provides a mechanism for administrators to keep track of the usage of the Oracle Analytics Cloud system. These statistics can be leveraged to take decisions to scale up, scale down, restrict access during certain time periods, pause/resume the system, and so on.
If you need any help with your Oracle Analytics Cloud Implementations, Please drop a line here. Our Oracle HCM Cloud experts will contact you promptly.


