Oracle Data Visualization extensions have been arguably one of the best features in Oracle Analytics Cloud (OAC) Data Visualization. Oracle has been doing a very good job in keeping the collection updated with new visualizations so that customers can use latest and greatest visualizations.
Presentation Variable Prompt is the one of the latest additions to set different column for the Visualization from within a DV canvas.

Presentation variable prompts allow to make dynamic columns or dynamic constants in any Oracle DV custom calculation.
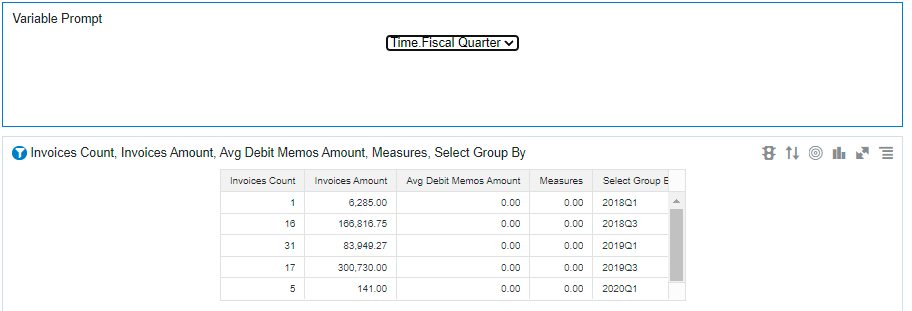
In this example if we select Year column from the presentation variable prompt, the corresponding measures will appear by year and year will show in the last column of below table.

If we select Quarter column from the presentation variable prompt, then the corresponding measures will appear by Quarter and Quarter will be shown in last column of the below table.

The same functionality can be used for all types of Visualizations. The prompts can be created for Attributes or Measures.
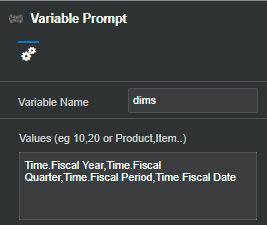
The variable prompt can be downloaded from Oracle website and the column names you want to use has to be given in the Values section as shown below.

As shown above, this can be of great use for business users where they can modify the attributes and measures of a Visual on the fly using Oracle Analytics Cloud (OAC)
If you need any help with your Oracle Analytics Cloud Implementations, Please drop a line here. Our Oracle Analytics Cloud experts will contact you promptly.


